El Niño is strengthening in the tropical Pacific, and the numbers behind the late-August search spike are genuinely unusual. NOAA has issued an El Niño Advisory, a new coral-based study reports a long-term rise in eastern Pacific variability, and forecasters see the event intensifying through the end of 2026.
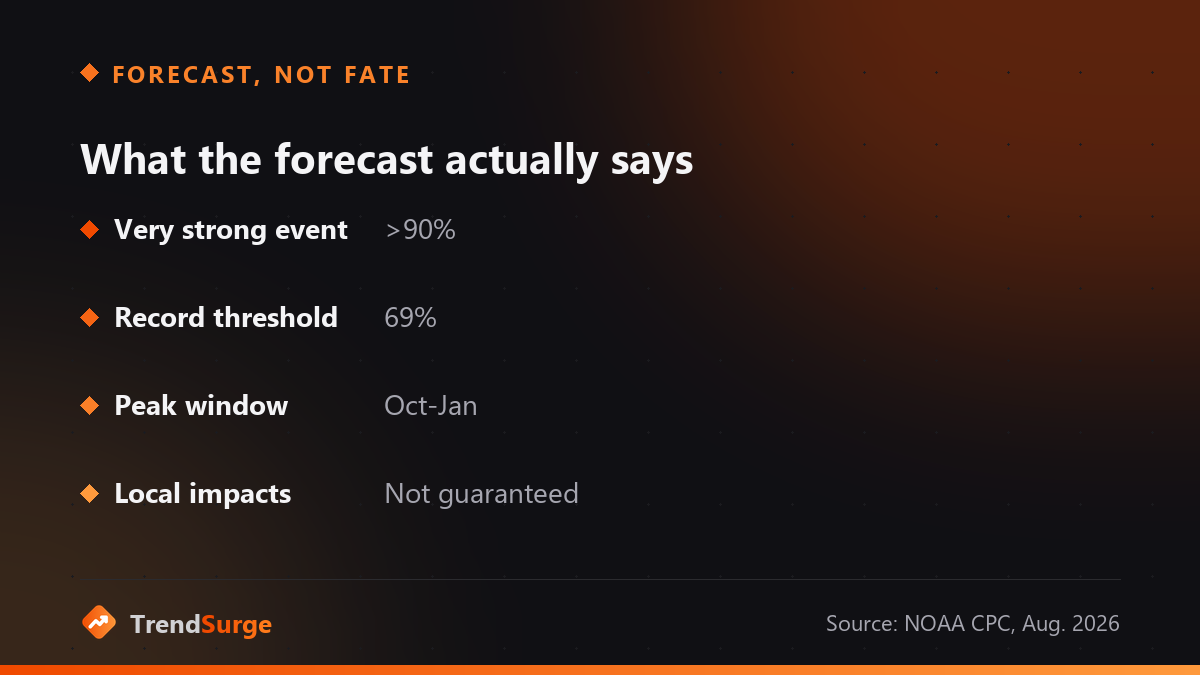
The actual forecast is a greater than 90% chance of a very strong El Niño this fall and winter, including a 69% chance that October through December exceeds every event in NOAA's record since 1950. That does not mean every familiar El Niño impact will happen, or that every place will simply get wetter. Strength raises the odds of characteristic patterns; it does not turn a seasonal outlook into a local guarantee.
That distinction is the center of the story. Two different developments arrived together: a forecast about the event happening now, and a peer-reviewed reconstruction asking whether El Niños have changed across roughly a millennium. They reinforce concern, but they do not answer the same question.
What NOAA is forecasting now
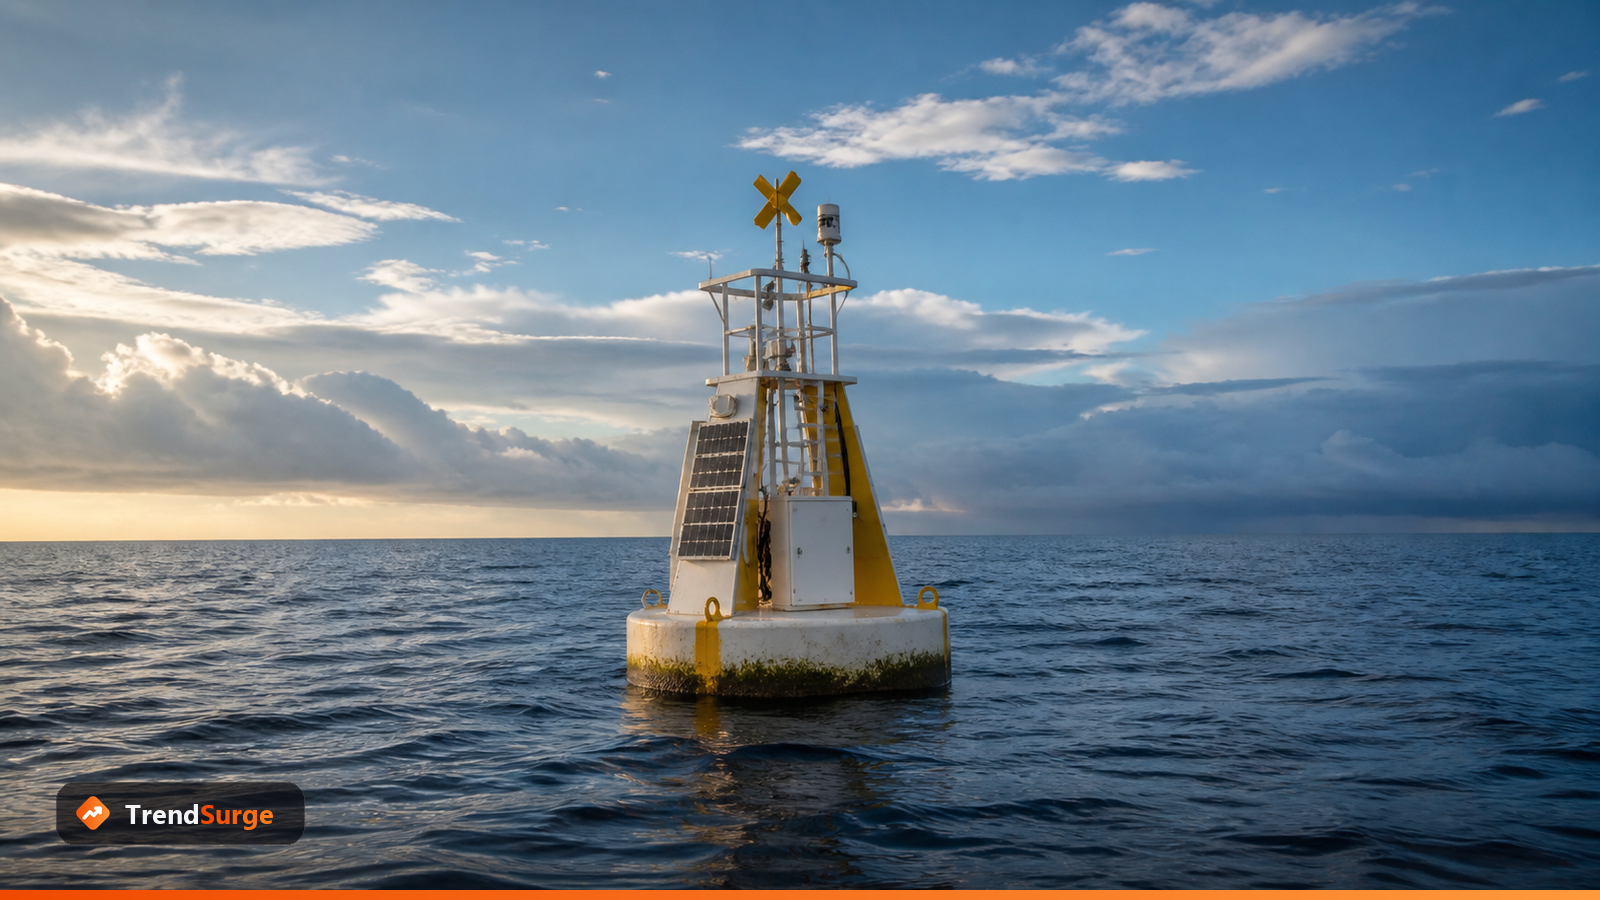
NOAA’s Aug. 13 diagnostic discussion says ocean and atmosphere measurements are behaving like a coupled El Niño system. Sea-surface temperature anomalies exceeded 2 degrees Celsius in the eastern equatorial Pacific. The July index was 1.4 degrees above the relative baseline in the Niño-3.4 region, while the eastern Niño-1+2 region reached 2.9 degrees above it. Winds, subsurface heat and tropical rainfall patterns also moved in the expected direction.
The agency’s official outlook combines observations with multiple models. It gives the event more than a 90% chance of reaching the “very strong” category during Northern Hemisphere fall and winter. For October through December, NOAA assigns a 69% chance to a three-month Relative Oceanic Niño Index of at least 2.5 degrees Celsius. That threshold would exceed the previous events in the agency’s record dating to 1950.
NOAA’s experimental GFDL forecast points the same way. All 30 members of its August model ensemble produced a peak that competes with the strongest events in the historical record, most likely between October and January. Agreement across model runs increases confidence, but an ensemble is still a range of plausible futures, not 30 independent promises.
Why “record strength” is not a weather forecast for your address
El Niño describes a large ocean-atmosphere pattern. It shifts the odds of rainfall, temperature and storm tracks across broad regions, but the resulting weather also depends on shorter-lived systems, geography and other climate signals. NOAA explicitly says that stronger events tend to increase confidence in expected impacts without guaranteeing them.
That is why a national headline cannot responsibly tell a reader that one city will flood or another will have no snow. Seasonal outlooks express probabilities for above-, near- or below-normal conditions. A daily forecast becomes meaningful much closer to the date.
The same nuance applies to hurricanes. El Niño often increases upper-level winds that disrupt Atlantic storm development, one reason the current season has been quiet so far. But it cannot block every storm. Our earlier look at the unusually quiet 2026 Atlantic hurricane season explains how that suppressing signal can coexist with individual tropical systems.
Nor does El Niño make a private winter almanac more precise. The Old Farmer’s Almanac winter forecast is a separate product with a different method and much less transparent probability information. NOAA’s regional outlooks are the appropriate source for updated U.S. temperature and precipitation odds.
The new coral study asks a bigger question
The forecast uses modern instruments and models. The study published Aug. 27 in Science tries to see beyond the short instrumental record.
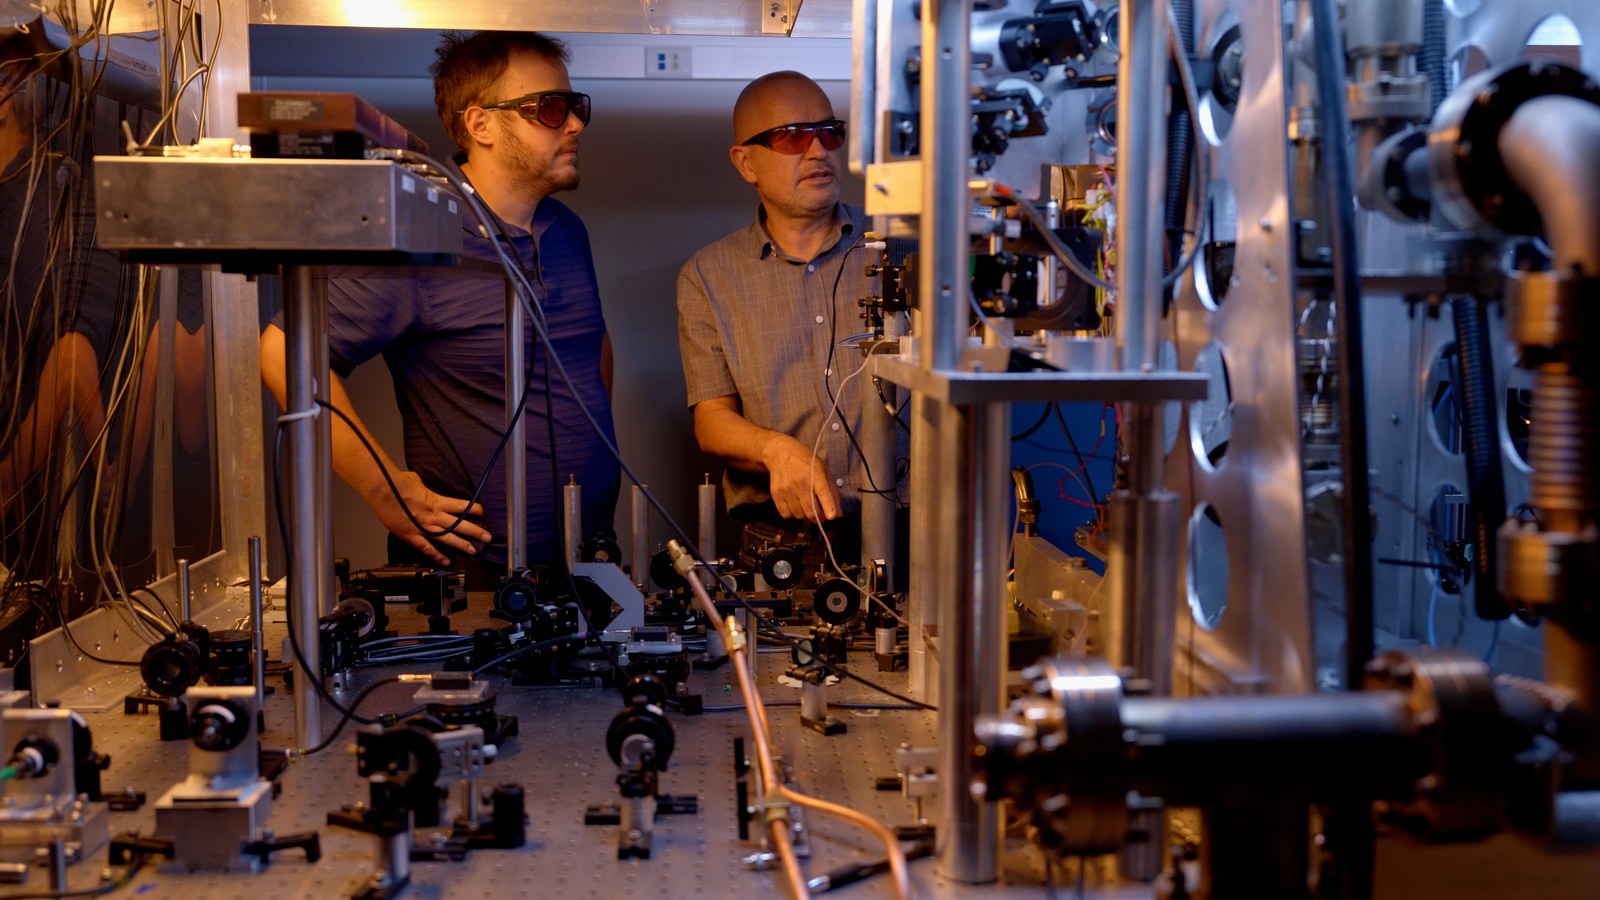
Researchers led by University of Michigan paleoclimatologist Julia Cole analyzed fossil corals from the Galápagos. Corals build skeletons in layers, and their chemistry preserves information about the seawater in which they grew. Ratios involving calcium and strontium, oxygen isotopes, and uranium-thorium dating let the team reconstruct patches of eastern Pacific temperature variability reaching back to about the year 1100.
The study reports that modern eastern Pacific ENSO variability is 36.5% higher than during the preindustrial millennium and 16.2% higher than during the twentieth century. Its interpretation is that human-caused warming is amplifying a climate pattern that was already naturally volatile.
That result is more informative than simply noting that 2026 feels extreme. A single event cannot establish a climate trend. A long proxy record can test whether recent decades sit outside a much wider range of natural variability.
It also has limits. The fossil record is not continuous, and it focuses on a particular part of the Pacific. The Associated Press reported that some outside researchers consider the coral evidence compelling while others argue that recent observations near the Galápagos do not line up cleanly with the proposed trend. The paper adds strong evidence to an active scientific debate; it does not end every debate about how ENSO changes.
The two percentages people are likely to confuse
The 69% forecast probability and the 36.5% study estimate are not interchangeable.
The first is the current chance that the October-December 2026 event crosses NOAA’s historic-strength threshold. It will be tested over the next several months as observations come in.
The second compares variability inferred from modern and ancient coral records. It describes a long-term change in the behavior of eastern Pacific ENSO, not a 36.5% increase in rainfall, storm damage or this year’s ocean temperature.
Confusing those numbers produces an easy but false conclusion: “Scientists say this El Niño will make disasters 36.5% worse.” Neither the paper nor NOAA’s outlook says that. Hazard depends on exposure, local conditions and the particular way the ocean-atmosphere system evolves.
This is also a useful example of why a trend spike needs context. Our guide to reading Google Trends without treating every spike as proof applies here: the surge shows attention, while the NOAA forecast and published research establish what the attention is about.
What a very strong event can change
A very strong El Niño can reorganize weather far beyond the tropical Pacific. Warm water shifts tropical convection, which can alter the jet stream and the position of storm tracks. Typical U.S. winter tendencies include wetter conditions across parts of the southern tier and warmer conditions across parts of the north, but the strength and placement vary from event to event.
Globally, El Niño can add heat to an already warm planet, stress coral reefs, disrupt fisheries, and change drought or flood risk. These impacts do not arrive uniformly. One region’s needed rain can be another region’s damaging deluge. Some consequences also lag the peak ocean index.
Preparation therefore works best when it follows the actual risk. Water managers watch reservoir and flood probabilities. Farmers follow regional precipitation and temperature outlooks. Coastal communities track marine heat and reef alerts. Households should use local weather services and emergency guidance, not a generic “super El Niño” map circulating months in advance.
The September NOAA checkpoint
NOAA scheduled its next ENSO diagnostic discussion for Sept. 10. Weekly ocean measurements will show whether the present rapid strengthening continues, while the monthly outlook will update the probability distribution for fall and winter.
The meaningful checkpoints are not just whether a single weekly index crosses a round number. Forecasters will watch whether warm anomalies persist across the three-month averaging window, whether the atmosphere remains coupled to the ocean, and how seasonal outlooks change for specific regions.
The careful conclusion on Aug. 31 is strong enough without exaggeration: the 2026-27 El Niño has a real chance to set a modern record, and a new millennium-scale reconstruction suggests that powerful eastern Pacific events are becoming more common as the planet warms. What no responsible source can provide yet is a deterministic weather script for every city. Record potential is a reason to follow the probabilities more closely, not a license to erase them.